Why Summer Is One Of The Best Times Of Year To Buy A Home in Berkeley
Real Estate Michael Perry July 1, 2026
Real Estate Michael Perry July 1, 2026
People assume spring is when the real estate market heats up in the Berkeley. They’re absolutely right. This is actually the case for the entire East Bay. Spring is when the toughest competition exists; the strongest buyer demand, the most amount of offers, and usually the least negotiating leverage for buyers. Real estate agents often say, "Summer can present the best chance at an opportunity for buyers." So this week we decided to see exactly what the data says about this.
We went back through the MLS and pulled every single-family home sale in Berkeley from 2023, 2024, and 2025. That’s 1,428 transactions. For each one, we looked at the number of offers received and the month the sale closed. Here’s what the data shows.
A quick note: These figures are organized by closing date, not list date. The average escrow period in this market is somewhere around 21-25 days. That means a home that closed in July most likely went into contract in mid-June. So when the data shows June and July closings receiving fewer offers, what it’s really telling you is that homes that hit the market in late May and June attracted less competition. The reduction in buyer activity begins slightly before the closing data suggests, which actually makes the summer opportunity more relevant for active buyers right now than a purely calendar reading might imply.
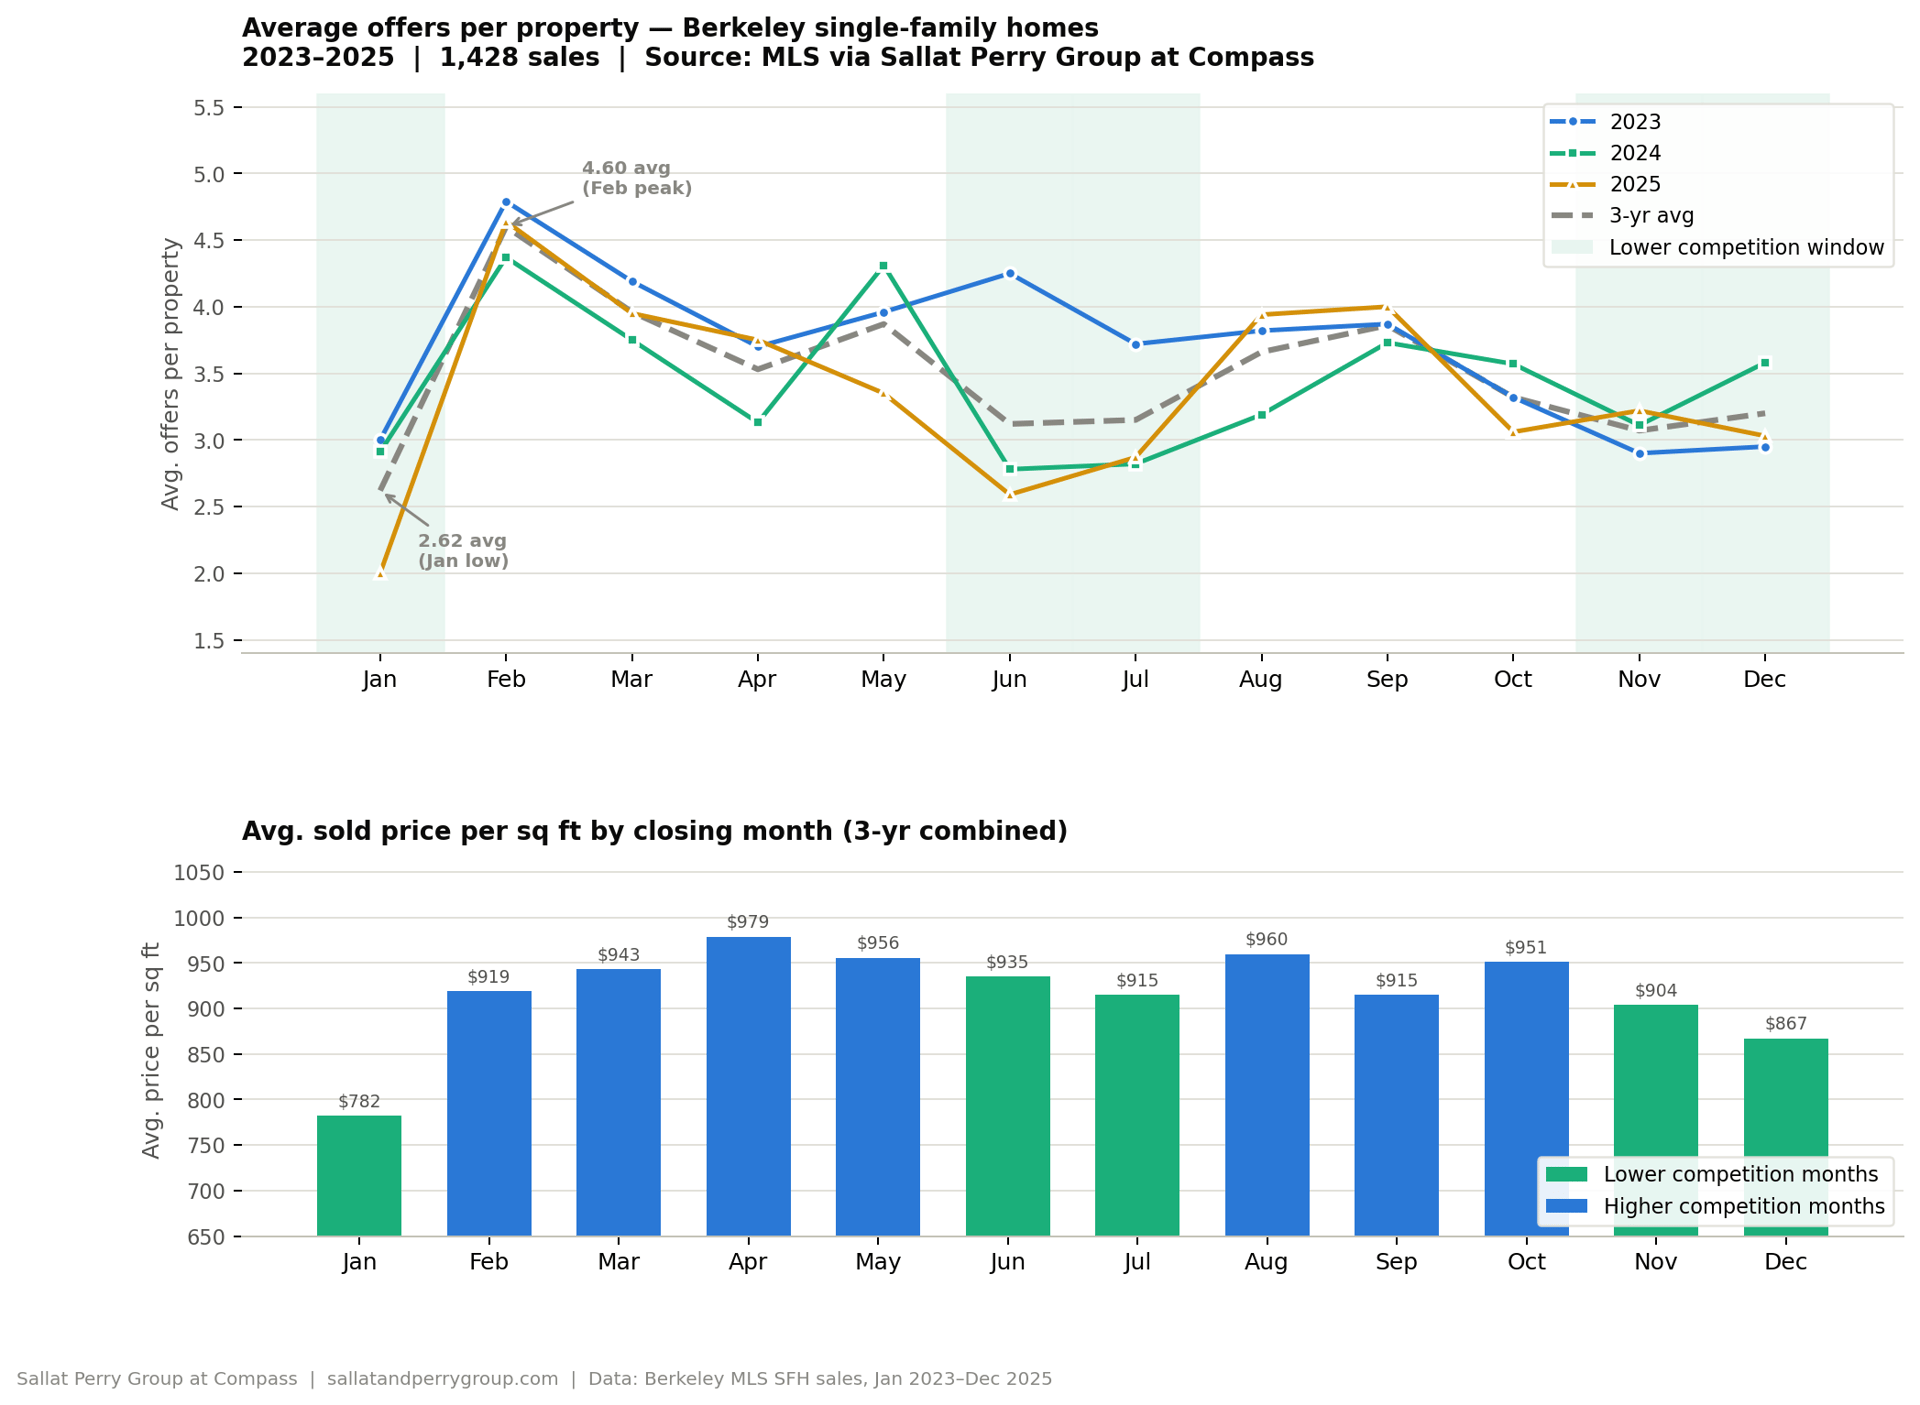
In February (the most competitive month of the year) Berkeley single-family homes received an average of 4.60 offers per property. That number held remarkably consistent across all three years.
In June and July, that average dropped to 3.12 and 3.15 respectively. January was the softest month of all at 2.62 average offers, after all, who in their right mind wants to buy a house at Christmas?! November came in at 3.07.
That may not sound like a dramatic difference. But think about what it means at the offer table. In a February market, you are almost certainly competing against four or five other buyers, even more for turnkey homes. In a June or July market, you may be up against one or two — or none at all. The dynamic of the negotiation changes entirely based on the number of offers received. In fact, no other criteria, outside of location & condition, impacts a home's sale price more than the number of offers received.
In 2025 specifically, June came in at just 2.59 average offers per property. That was the single lowest month-year reading across the entire three-year dataset.
Average offers per property and avg. sold price per sq ft by closing month — Berkeley SFH, 2023–2025
The reason is exactly what you’d expect.
The winter holidays bring real estate activity to a near halt. Most buyers aren’t scheduling showings in November and December. Most sellers aren’t listing during that window either. But the desire to buy doesn’t go away, it just takes a holiday. By the time January arrives, there’s a meaningful pool of buyers who took a break over the holidays and there are new buyers that enter into the market, too. That pent-up demand hits the market all at once in February, which is precisely why February is consistently the most competitive month in this dataset. It’s not that February has the most homes, it often doesn’t. It’s that it has the most buyers per home, all chasing a still-limited supply.
Spring then does something important: it works that demand down. As listings increase through March, April, and May, buyers who have been waiting finally get into contract and close. The pool thins out a bit. Families with kids in school spend the spring trying to close before summer so they can get settled before the new school year. Once school is out, attention shifts to travel, camps, schedules that are harder to coordinate. Buyers who were intensely focused in March and April are now taking a breath. The homes are still there. The pent-up demand that fueled the February frenzy has largely been absorbed. The competition, for a few months, is not.
This isn’t a Bay Area anomaly. It’s a seasonal pattern that plays out in competitive markets across the country. What makes the East Bay interesting is that the underlying demand never actually disappears. Instead, it just softens temporarily. When fall arrives, it comes back for a final push before the holidays.
This is where the data gets even more interesting.
Across the three-year dataset, average sold price per square foot by month tells its own story. In the lower-competition months, prices per square foot were measurably lower:
● January: $782/sq ft
● November: $904/sq ft
● December: $867/sq ft
● June: $935/sq ft
● July: $915/sq ft
Compare that to the spring peak:
● April: $979/sq ft (highest of the year)
● March: $943/sq ft
● May: $956/sq ft
That’s a difference of roughly $60–$200 per square foot between the most and least competitive months. On a 1,500 square foot home, that’s $90,000 to $300,000 simply from timing.
And when we look at the relationship between number of offers and price per square foot across all 1,423 transactions, the correlation is unmistakable:
Offers received | Avg price per sq ft |
0 offers | $896 |
1 offer | $872 |
2 offers | $887 |
3 offers | $933 |
4–5 offers | $962 |
6–8 offers | $983 |
9+ offers | $1,073 |
Keep in mind these are averages, too. Therefore, the condition of the homes are not considered. If we were to track how these numbers play out solely on turnkey homes it would be much more extreme. Homes that received 9 or more offers sold for an average of $1,073 per square foot. Homes that received just 1 offer averaged $872 per square foot. That’s a 23 percent premium paid almost entirely by buyers transacting during peak season.
None of this means the East Bay housing market is soft. It is quite the opposite. The fundamental forces driving long-term value here (topic of last week's blog) are two of the world’s top ten universities, a concentration of AI, finance, and biotech jobs that has no parallel anywhere else in the country, and a built-out housing supply that has nowhere to expand. The demand is durable and prices are not declining.
What summer offers is a potential window. Not a discount on a distressed asset, but a brief reduction in competition that gives a prepared buyer room to breathe, room to negotiate, and a better chance of getting into a home at a price that reflects the property rather than the frenzy.
That window closes. The fall market in Berkeley and Oakland tends to recover its competitive edge quickly. September and October in this dataset averaged 3.86 and 3.32 offers per property respectively — closer to spring than to summer.
For those who have been watching the market and waiting for the right moment, this is a reasonable time to be active. Inventory in the Inner East Bay: Berkeley, Albany, El Cerrito, Kensington, Piedmont, Rockridge remains limited, but the buyers who were aggressively competing in February and March have somewhat thinned out.
That doesn’t mean they’ll find a bargain. It means they may find a home without a six-offer situation standing between them and the home.
Stay up to date on the latest real estate trends.
Whether you’re buying your first home or listing a cherished property, Sallat & Perry Group brings unmatched East Bay insight and a personalized strategy to every transaction.